I’ve finally graduated from SMU’s Certified Data Analytics (R) Specialist course. It was an amazing 5 months, full of ups and downs. I kept my fingers crossed over the first three modules of the course, praying not to fail at each assessment. My code was plagued with errors which took many many hours to resolve.
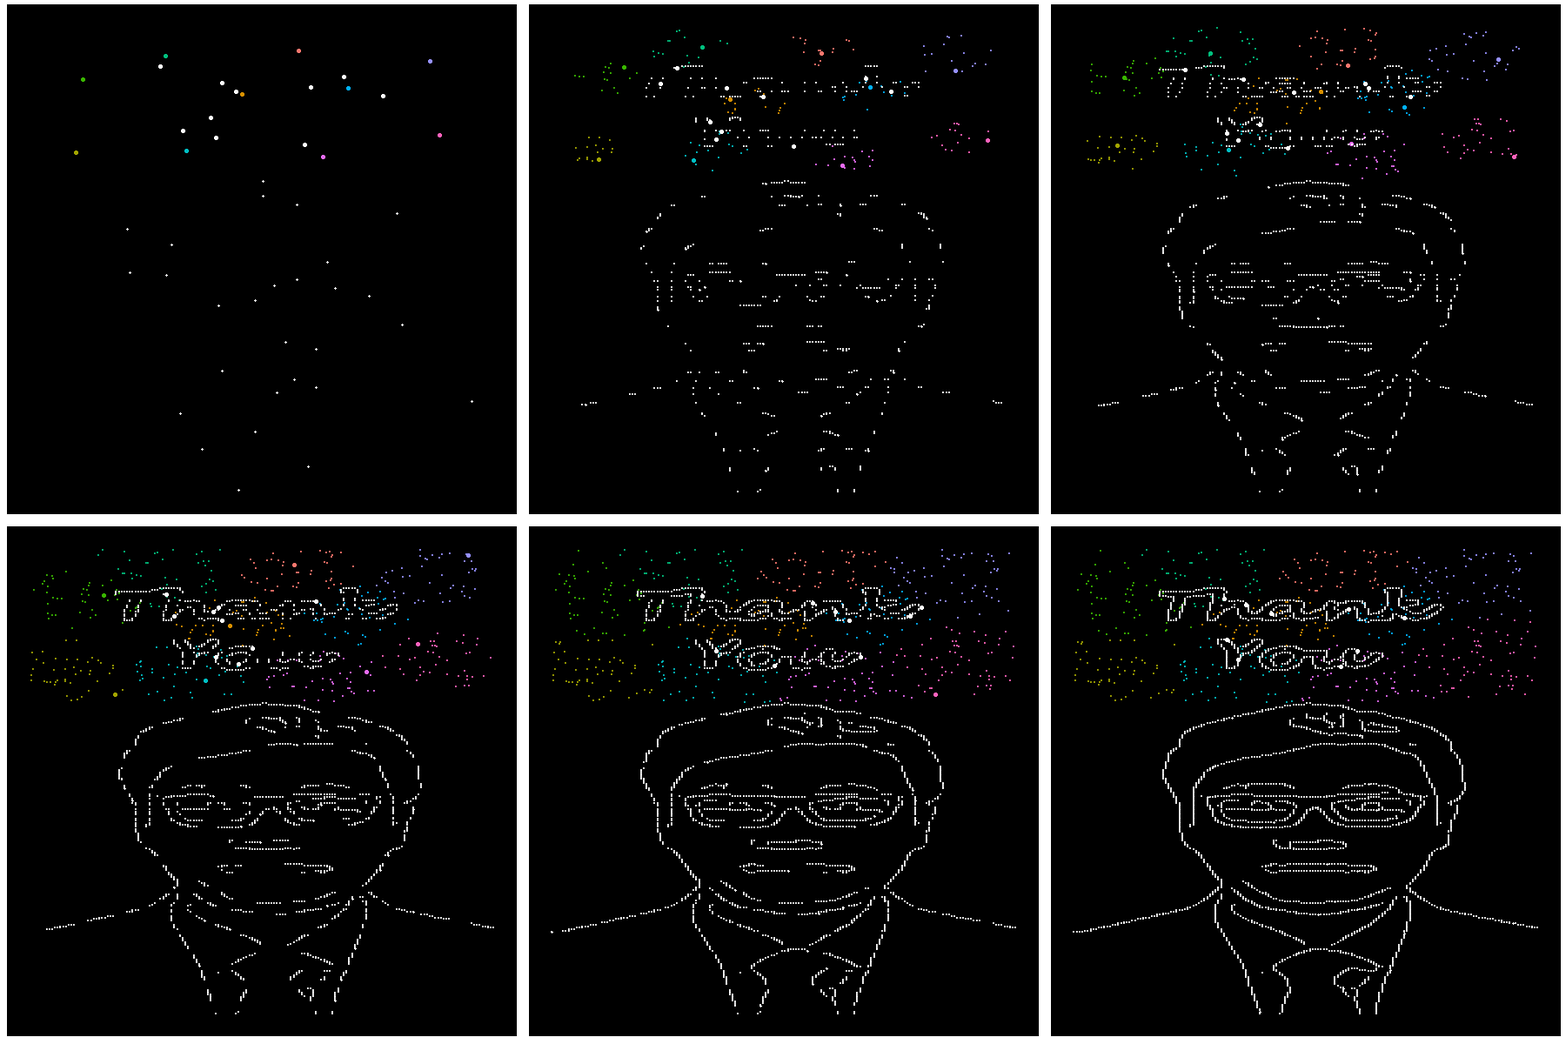
It wasn’t till November 2023 that I was able to follow along in class, and complete each lesson without any coding errors. I made this animation as a graduation present for Professor Roh. He is an amazing person.

The code for generating this animation can be found below. The most difficult part I experienced was writing the code for the fireworks display. Yes, the colorful dots at the top of the animation are about 10 clusters of fireworks. I used a kmeans algorithm to “partition” a selection of “sparkles” into clusters about a center. Subsequently, I had to figure out how to sequence the appearance of each sparkle. The desired effect I wanted to achieve was for each sparkle closest to their respective center to appear.
You may use or modify the code for your own animation, but I would greatly appreciate a link back, please.
# Clear global environment ----
rm(list = ls())
# Load packages ----
library(tidyverse)
library(imager) #package for image processing
library(gganimate)
library(randomcoloR) #generate random colors

#set.seed(20240114)

# Read in coordinates of photo ----
df <- read_csv("prof_rohV2_coord.csv")
df_length <- nrow(df)
df <-
  df%>%
  rename(order = n) %>%
  mutate(order = rep(1:72, length.out = df_length))
# 72 represents what WAS the max sparkles per cluster. In the next revision
# this will be the first item to fix. Unfortunately, this project was assembled
# 3 parts (photo, fireworks, thank you) in a very short time

# Find min max x,y of photo to determine subsequent position of thank you
# and fireworks elements.
xmin <- min(df$x)
xmax <- max(df$x)
ymin <- min(-df$y)
ymax <- max(-df$y)


# Creating fireworks ----
# Generate data for fireworks

i <- 10 # number of clusters
s <- 50 # number of sparkles per center

# generate 10,000 random dots per cluster
dots <-
  tibble(x = runif(n = 10000*i, min = xmin, max = xmax),
         y = runif(n = 10000*i, min = ymax, max = 100)) #adjust relative positioning
# s * i gives number of dots per display


# generate color table. c controls color, cluster_n is the cluster number
# you could always specify your own colors
color_table <-
  tibble(cluster_n = 1:i,
         c = randomColor(i)
         )
# sample s*i number of sparkles per cluster of fireworks
sparkles <-
  tibble(x = sample(dots$x, s*i),
         y = sample(dots$y, s*i)
         )
# use kmeans algorithm to partition sparkles to each center
km <- kmeans(sparkles,
             centers = i,
             iter.max = 50,
             nstart = 1)

# Information on centers of each fireworks cluster
center <-
  tibble(c_x = km$centers[,1],
         c_y = km$centers[,2]) %>%
  mutate(cluster_n = 1:n())

# Information on cluster allocation ie: tells you which sparkle is assigned to each cluster
cluster <-
  tibble(cluster_n = km$cluster)

# generate the fireworks by assembling all plot info
fireworks <-
  bind_cols(sparkles, cluster) %>% # sparkles assigned to cluster
  left_join(., color_table, by = "cluster_n") %>% # color assigned to cluster
  left_join(., center, by = "cluster_n") %>% # center assigned to cluster
  # next 4 lines of code have to do with sequencing of sparkles for animation
  # i wanted sparkles closest to each center to start together in the animation
  mutate(distance = sqrt((x - c_x)^2 + (y - c_y)^2)) %>% #calculate distance between sparkle and center
  group_by(cluster_n) %>%
  arrange(distance) %>% #arrange by ascending distance
  mutate(order = 1:n()) %>% # ordering for animation sequence
  ungroup()


# Read in coordinates of thank you ----
df_t <- read_csv("thankyou.csv")
df_t_length <- nrow(df_t)
df_t <-
  df_t %>%
  rename(order = n) %>%
  mutate(order = rep(1:72, length.out = df_t_length))

# Finally we plot ----
p <-
  ggplot() +
  # plot the face
  geom_point(data = df,
             aes(x = x,
                 y = -y, # right-side the image. imagine reflecting off x-axis
                 group = order),
             size = 1.25,
             color = "white") + # change back to white
  # plot fireworks
  geom_point(data = fireworks %>% filter(cluster_n == 1), #one geom per cluster
             aes(x = x, y = y, color = c), size = 2) +
  geom_point(data = fireworks %>% filter(cluster_n == 2),
             aes(x = x, y = y, color = c), size = 2) +
  geom_point(data = fireworks %>% filter(cluster_n == 3),
             aes(x = x, y = y, color = c), size = 2) +
  geom_point(data = fireworks %>% filter(cluster_n == 4),
             aes(x = x, y = y, color = c), size = 2) +
  geom_point(data = fireworks %>% filter(cluster_n == 5),
             aes(x = x, y = y, color = c), size = 2) +
  geom_point(data = fireworks %>% filter(cluster_n == 6),
             aes(x = x, y = y, color = c), size = 2) +
  geom_point(data = fireworks %>% filter(cluster_n == 7),
             aes(x = x, y = y, color = c), size = 2) +
  geom_point(data = fireworks %>% filter(cluster_n == 8),
             aes(x = x, y = y, color = c), size = 2) +
  geom_point(data = fireworks %>% filter(cluster_n == 9),
             aes(x = x, y = y, color = c), size = 2) +
  geom_point(data = fireworks %>% filter(cluster_n == 10),
             aes(x = x, y = y, color = c), size = 2)+
  # plot thank you
  geom_point(data = df_t,
             aes(x = x,
                 y = -y+90, # positioning adjustment for relative positioning of items
                 group = order),
             size = 2,
             color = "white") +
  theme_set(theme_void()) +
  theme(panel.background = element_rect(fill = 'black'),
        legend.position = "none",
        # rmarkdown refused to knit without gridlines or recognize theme_void() so I am removing them manually
        axis.text.x = element_blank(),
        axis.text.y = element_blank(),
        axis.ticks = element_blank(),
        panel.border = element_blank(),
        panel.grid = element_blank(),
        axis.title.x = element_blank(),
        axis.title.y = element_blank()
        ) +
  # set animation transition
  transition_time(order)+
  shadow_mark(alpha = 0.8, size = rel(0.8))

# Render animation ----
animate(p, fps = 20, nframes = 200, end_pause = 60, height = 600, width = 600)