Introduction
I’m attending the Certified Data Analytics (R) Specialist course taught by Professor Sungjong Roh at SMU Academy. In Module 3: Web scraping and Data Insights, we learnt the basics of Natural Language Processing (NLP) and Sentiment Analysis of text.
I was particularly intrigued by the topic of Sentiment Analysis, and furthered my knowledge by reading the book “Text Mining with R: A Tidy Approach” by Julia Silge & David Robinson.
You may access read the book by following this link.
Project
To further hone my skills in R, basic natural language processing (NLP) and sentiment analysis, I thought that it would be cool to do a sentiment analysis of my family’s Whatsapp group chat. This group chat was started in June 2019 and comprises 4 members, my wife (Angelina) , my two sons Marc (age 18) and Andrew (age 13) and me.
The chatgroup contains approximately 65,000 messages, and is used mainly to coordinate schedules, update whereabouts of each member, and chatting about anything under the sun. My end goal is to see if the tools I learnt in class could be used to provide an insight into the:
overall sentiment of our chatgroup. Do we generally use positive language (I hope so) or is the group environment toxic (that would be a disappointment!).
individual sentiment of each member of the chatgroup. Are there members who are positive/negative and does that “gel” with my knowledge of their personality? Were there periods of positive or negative sentiment throughout the year(s), and does that tie-in with any significant events the family was experiencing?
Exporting Whatsapp Chat
This is fairly easy to do, and the chat exports as a single text file with date/timestamp. Unfortunately, stickers and emojis which are often used in our chatgroup cannot be exported.
Import and Data Wrangling
The chat file can be imported into R using read_csv(). The chat.txt file imported from Whatsapp was relatively “clean”, and required minimal wrangling.
The date of message sent, name of sender, and text message were extracted using a combination of str_extract() and regex patterns. Date was subsequently formatted using dmy(). NA data was filtered using na.omit(). Finally, a “message_id” was assigned to each row using the function rowid_to_column()
Data Visualization
Let’s find out who sent the most messages within the chatgroup.
Anyone want’s to make a guess?
Surprise surpise! My wife sent the most messages within the group! Let’s take a look at the number of daily messages sent in the chatgroup since its inception.
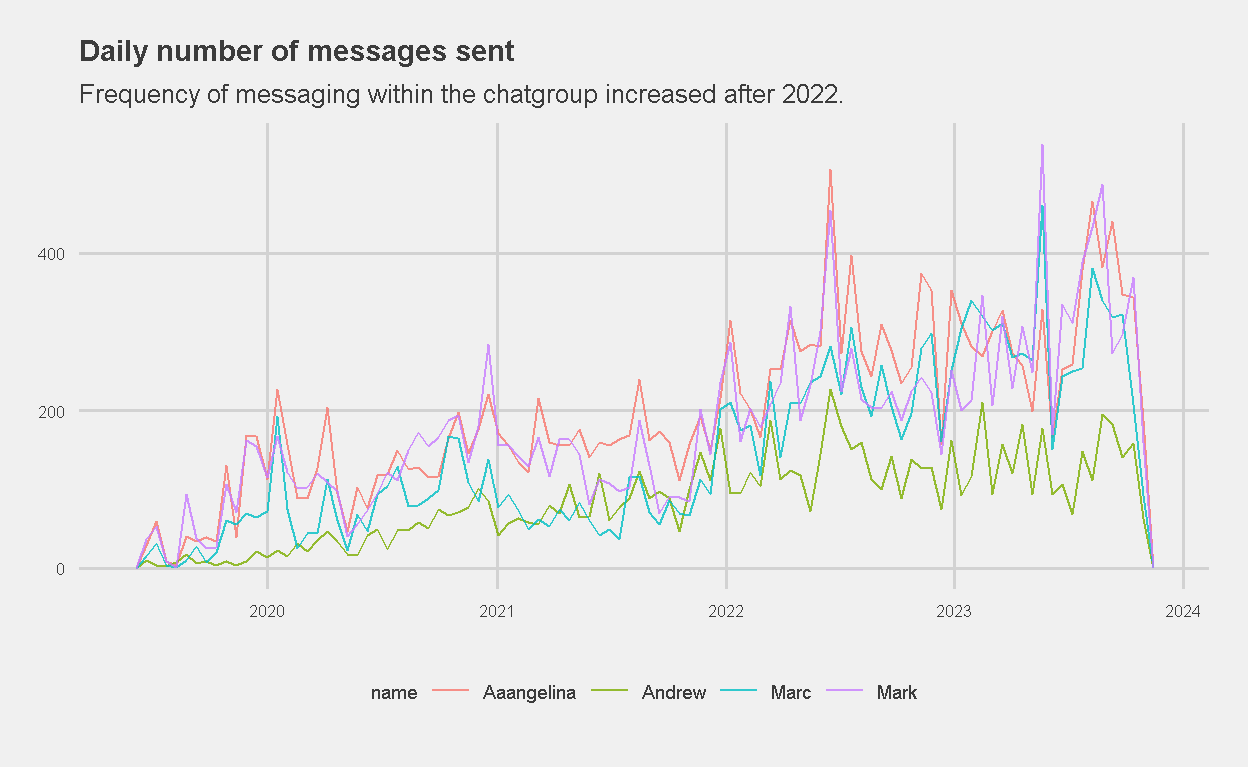
Figure 1: Daily Number of Messages Sent in chatgroup (2019 to date)
Interesting! The number of daily number of messages within the chatgroup increased after 2022. Perhaps as life returned to a “post-covid normal”, messaging within the group increased as we were “out and about” much more, and required more coordination amidst our activities. Or maybe we were just more active on our phones?
Tokenize the words
In order to run sentiment analysis on the chat, each message needed to be parsed into individual words. This process of “tokenizing” the words is easily done within R using the function unnest_tokens(). This resulted in approximately 515,000 tokens.
Next, I removed “stop-words” using tidytext::stop_words and anti_join(). These stop-words carry “no meaning” in sentiment analysis and are therefore removed prior to analysis. You are also able to remove names or other words you deem irrelevant by adding them to a custom lexicon. You will read more about that later…
AFINN, BING and NRC
Here’s a short introduction of the 3 sentiment lexicons I used to assist with sentiment analysis:
AFINN is a lexicon of English words rated for valence with an integer between minus five (negative) and plus five (positive). The words have been manually labeled by Finn Årup Nielsen in 2009-2011. You can read more about AFINN here.
Bing is a general purpose English sentiment lexicon that categorizes words in a binary fashion, either positive or negative. It was first published by Minqing Hu and Bing Liu in 2004. You can read more about Bing here.
The NRC Emotion Lexicon is a list of 5,636 English words and their associations with eight basic emotions (anger, fear, anticipation, trust, surprise, sadness, joy, and disgust) and two sentiments (negative and positive). You can read more about NRC here.
I used these 3 “dictionaries” to perform sentiment analysis on the word tokens.
Lets do some very basic EDA
Using the AFINN indexed list of words (data_for_NLP_AFINN_indexed), here is the top 20 most frequently used words in our chatgroup:
| Word | Count |
|---|---|
| love | 1241 |
| leave | 794 |
| nice | 478 |
| wow | 332 |
| drop | 272 |
| bad | 244 |
| fun | 225 |
| haha | 214 |
| yeah | 212 |
| safe | 201 |
| join | 186 |
| free | 184 |
| hope | 184 |
| cut | 179 |
| happy | 156 |
| clean | 155 |
| shit | 142 |
| fine | 140 |
| luck | 128 |
| enjoy | 125 |
Now here’s a slight problem. The word “leave”, which has a frequency of 794 and carries a sentiment score of “-1” in AFINN. As our family frequently uses the chatgroup to coordinate our schedules, the word “leave” is likely taken our of context here.
For example: “Let’s leave at 9am” or “We plan to leave at 7pm today.” As opposed to ” I have going to leave you!” which has a negative context.
Remember I mentioned above about adding “custom” stopwords? To avoid potentially skewing the results, I decided removed the word “leave” by including it as a “custom lexicon” stop-word. Thereafter, I ran the analysis using AFINN again.
Similarly, the word “swim” is found within the NRC sentiments of anticipation, fear (really? why?) and joy. As both my sons are competitive swimmers and the word “swim” is used very frequently within our chat (760 times to be exact!), “swim” was removed as well.
Just for fun, and probably to show off what I learnt in class, here is a word cloud after removing the word “leave”.
Figure 2: WordCloud: Top 50 words after removing “leave”
As you can see, its a rather nice chatgroup to be a part of, with positive words such as “love”, “nice” and “happy”. Of course, there are also negative words being used, of which “shit” stands out. I’m cautiously optimistic that the overall AFINN index of our chat will be positive. 🤞
Have fun with word cloud
Word cloud is rather fun and it’s easy to get carried away. So here’s a couple more. This is a word cloud of our top 50 most frequently used words with a sentiment score <0.
Figure 3: Top 50 Frequently used words with negative sentiment score
This is a word cloud of my top 50 most frequently used words. Hey, I use “love” quite a lot :)
Figure 4: WordCloud: Mark’s Top 50 most frequently used words
Here is Marc’s top 50 most frequently used words. Now we know who uses the word “shit” frequently. Still, it looks relatively positive.
Figure 5: WordCloud: Marc’s Top 50 most frequently used words
This is Andrew’s top 50 most frequently used words. It would appear that he uses the word “love” quite frequently. 💖
Figure 6: WordCloud: Andrew’s Top 50 most frequently used words
Last but not least, here is a word cloud of my wife’s top 50 most frequently used words.
Figure 7: WordCloud: Angelina’s Top 50 most frequently used words
Sentiment Analysis using AFINN Index
Let’s shift gears and take a deeper look at what the AFINN indexed list of words reveal about the sentiment within our chatgroup.
The list of tokenized words were analyzed using the AFINN dictionary, where each word is given a sentiment score ranging from -5 (negative sentiment) to +5 (positive sentiment).
I calculated an average sentiment score and standard error for each member of the family.
| Name | Average Sentiment | Standard Error |
|---|---|---|
| Andrew | 1.378 | 0.074 |
| Mark | 0.659 | 0.032 |
| Aaangelina | 0.639 | 0.031 |
| Marc | 0.112 | 0.058 |
| Family | 0.627 | 0.020 |
My wife and I had an average sentiment score similar to that of the overall “Family”. Andrew had the highest average sentiment score (perhaps he uses the word “love” too often?) while Marc had the lowest average sentiment score.
Here is a boxplot summarizing the results,
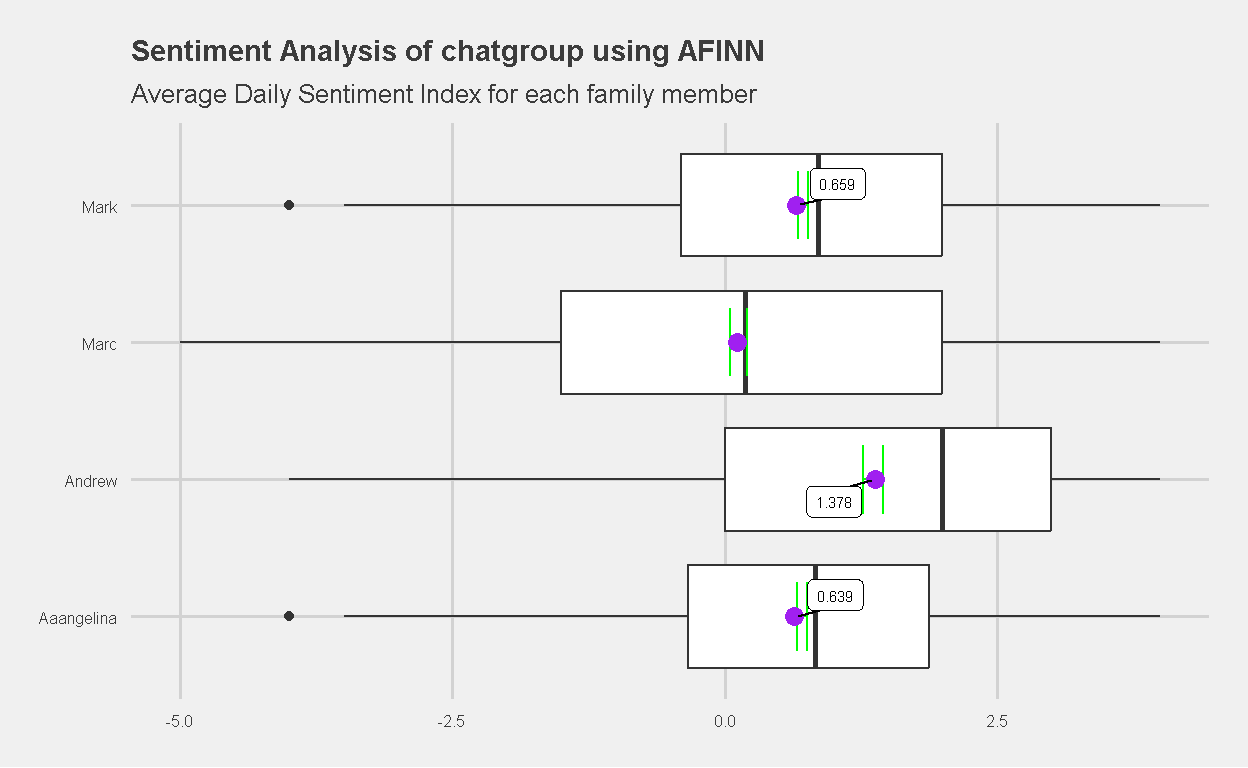
Figure 8: Sentiment Analysis of Yeo Family chatgroup (AFINN)
The difference in average sentiment score between Marc and Andrew stands out. Andrew’s AFINN sentiment score is much higher than Marc’s. Does this simply imply the use of more positive language within the chat, or does it make inference to a difference in their personalities? Can the difference be attributed to age where a younger child tends to be more openly expressive with his feelings, while an older child is more “reserved”?
Personally, I am surprised that the AFINN sentiment analysis of our chats was able to quite accutately make inference to the personality of my children. Marc tends to be more reserved and neutral, which may explain his use of words that are less “emotionally charged” and balanced. On the other hand, Andrew is more outgoing, bubbly and optimistic, which may explain his higher average sentiment score. Or maybe he simply loves the word “love” which carries a sentiment score of +3.
Cumulative Average Daily Sentiment
Next, I plotted the cumulative average daily sentiment for each member of the family. I’m not sure what I was hoping to find. If you had a neutral average daily sentiment score, the line should be flat. If you were generally positive, I’d expect an upward sloping line. Conversely, periods of sustained negative sentiment would result in a downward trend.
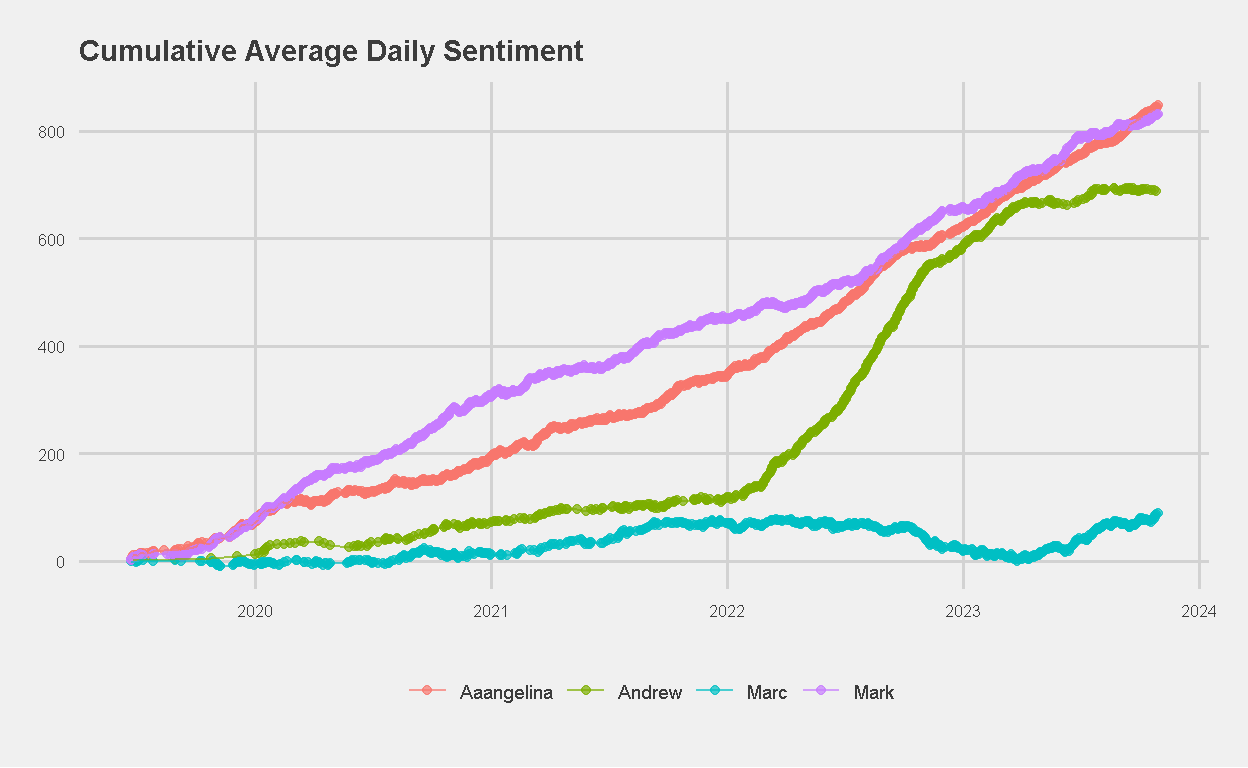
Figure 9: Cumulative Average Daily Sentiment Score (AFINN)
A couple of interesting observations:
Andrew had a significant increase in cumulative average daily sentiment score between 2022 and 2023. We discussed this, and brainstormed for possible reasons. I felt that possibly “covid reopening” and “life back to normal” was a contributing factor to his improved sentiment. Being more outgoing, perhaps covid-restrictions had a larger impact on his sentiment. Andrew thinks that his move to a different competitive swim club with a “less toxic” culture and people might have been a contributing factor in lifting his general mood.
The plot for Marc is almost flat throughout the year, reaching a peak score of only 75. This could imply days of positive average sentiment cancelling out days of negative sentiment, or simply the use of language that is “emotionally neutral”. Alarmingly, the plot showed a decline from mid-2022 to the start of 2023. We brainstormed for possible reasons to explain this, but none come to mind.
Here is Marc’s plot.
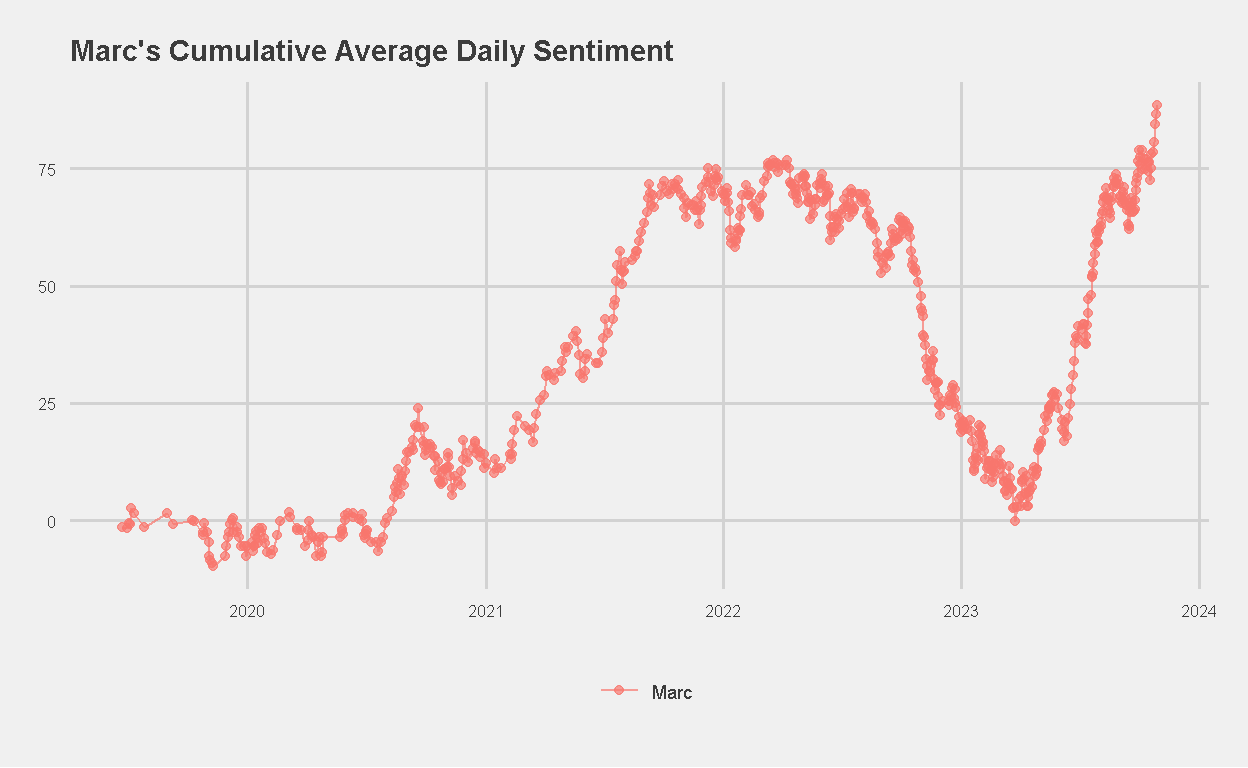
Figure 10: Marc’s Cumulative Average Daily Sentiment Score (AFINN)
Sentiment Analysis: Marc vs Andrew
I am curious to explore the difference in sentiment scores between Marc and Andrew. To investigate further, I looked for words that they used in common, and analyzed to see if the frequency of usage of these words contributed to the difference in their sentiment scores.
To do this, I first created individual AFINN-indexed word lists for each child. Marc used 1783 AFINN-indexed words, while Andrew used 921 AFINN-indexed words. I then calculated their respective frequency of AFINN-indexed word usage.
Next, I created a list of AFINN-indexed words that they used in common using inner_join(). This resulted in a list of 138 AFINN-indexed words that they used in common.
I created a plot of these 138 words that they used in common, with the frequency of word usage by Andrew on the x-axis, and the frequency of word usage by Marc on the y-axis.
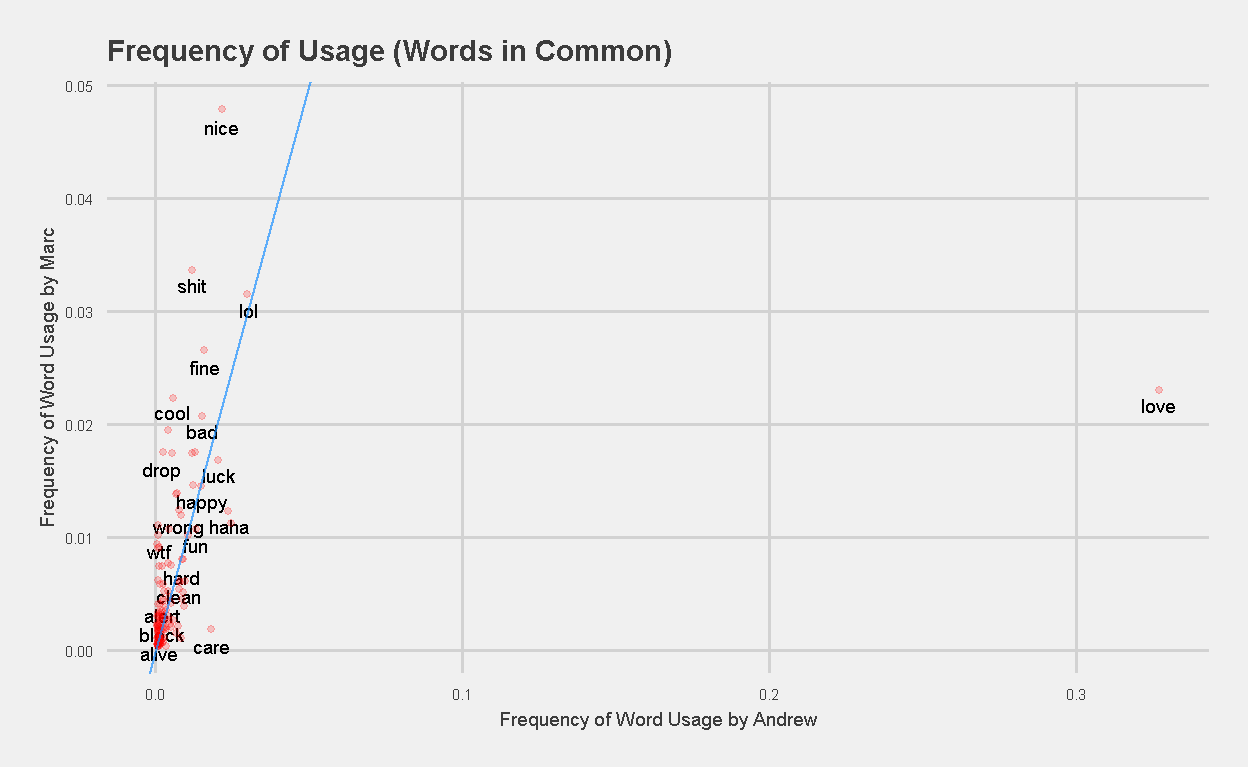
Figure 11: Frequency of Usage (Words in Common) Marc vs Andrew
Its quite apparent that the frequency of usage of the word “love” by Andrew is an outlier (32% vs 2% usage by Marc). In order to get a clearer picture of the other words in use, I removed the word “love” before generating the same plot again.
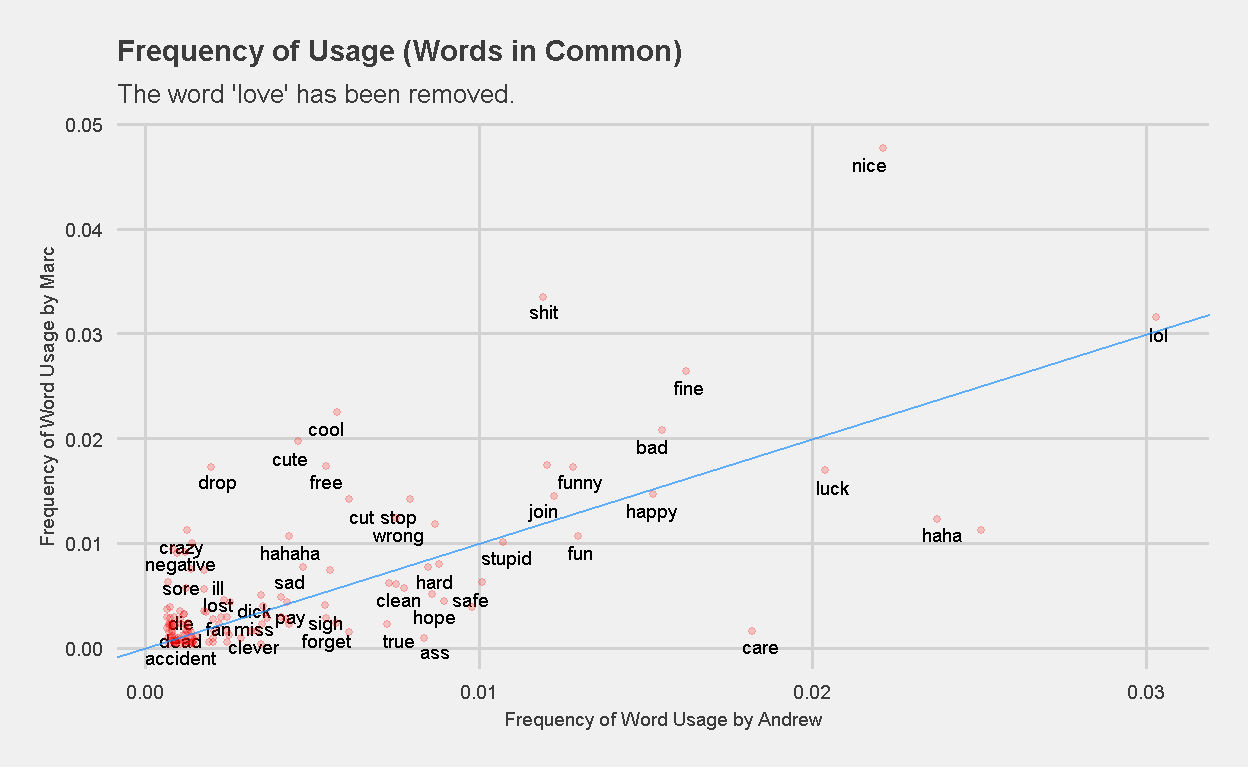
Figure 12: Frequency of Word Usage (Words in Common) Marc vs Andrew. The word love has been removed.
You may notice (or if you actually counted), not all 138 (or 137 minus the word “love”) words have been plotted. That is because “check_overlap” in geom_text() has been set to TRUE to avoid the text from overlapping.
Words that are close to or on the blue line (AB Line with slope = 1, intercept = 0) represent words that both children use with similar frequency. Examples of these words are “super”, “died”, “stupid”, “happy”, and “lol”. Marc uses the words “nice” and “shit” more frequently than Andrew, while Andrew uses the words “haha”, “yeah”, and “care” more frequently than Marc.
Is it apparent now why Andrew might have a higher AFINN sentiment score in his chats? Maybe the next plot will give a clearer indication. I multiplied the frequency of each word used by its AFINN sentiment value.
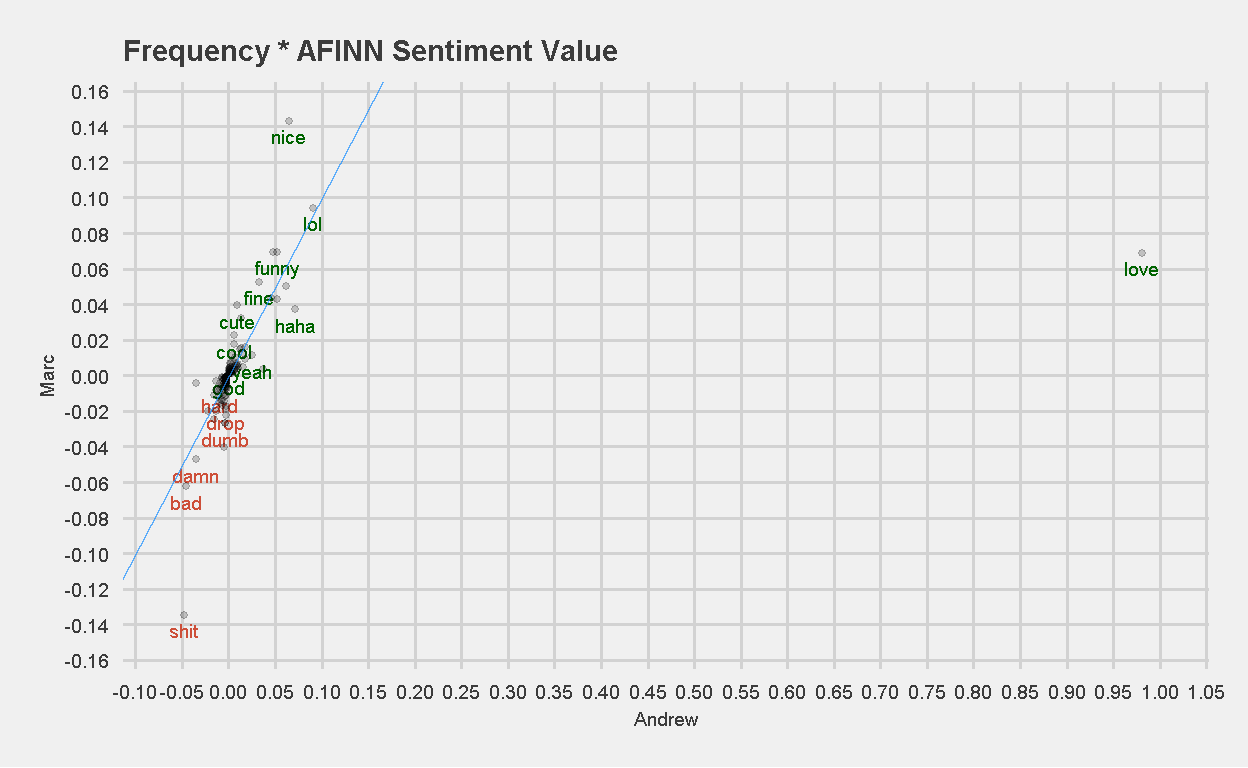
Figure 13: Frequency of word used x AFINN Sentiment Value
Again, we see the use or excessive use of the word “love” most likely skewing Andrew’s sentiment score vs Marc, which is not a bad thing :). Let’s look at the same plot with the word ‘love’ removed.
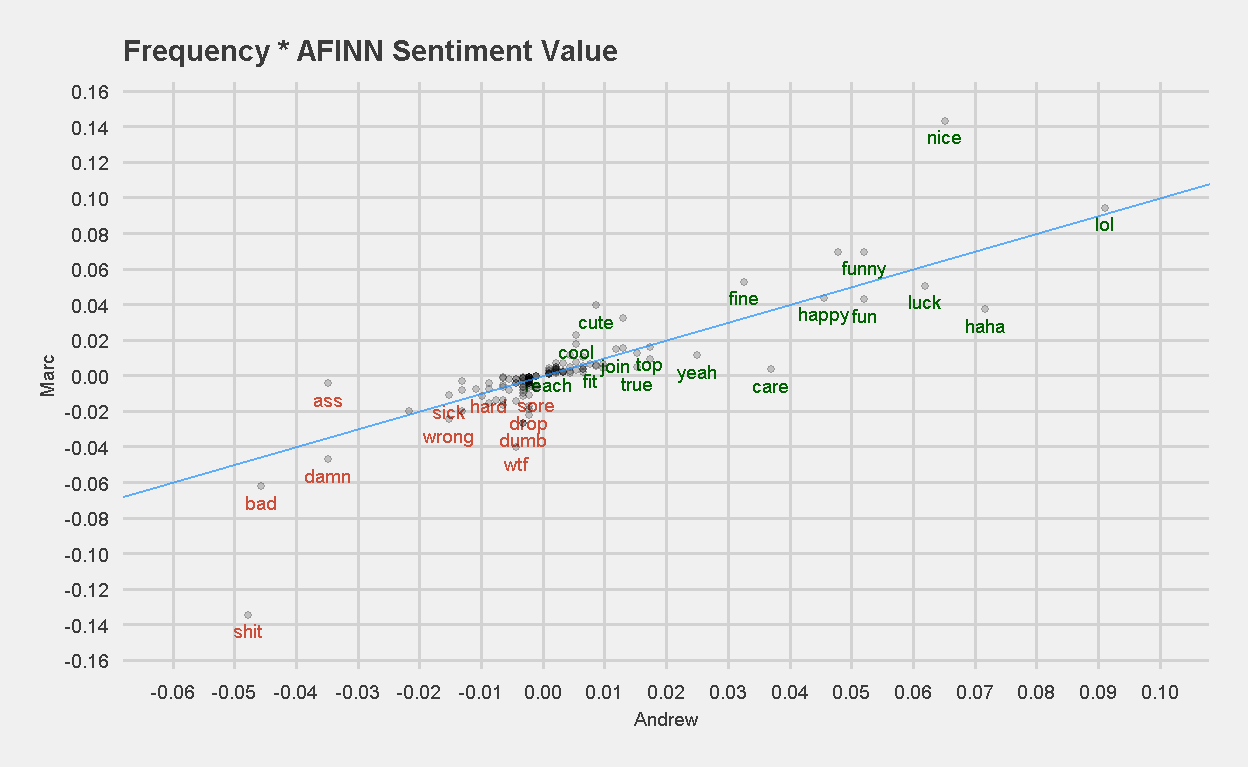
Figure 14: Frequency of word used x AFINN Sentiment Value. The word ‘love’ has been removed.
Tokenizing by n-grams
Thus far, I’ve only considered words as individual units, and evaluated their relationships to sentiments. However, tokenizing by single-words has its drawbacks because relationships exist between words that follow one-another.
This is because words correlate with one another, and the choice of first word can significantly change the meaning of the second word. For example, putting “not” before “love” significantly changes the meaning and therefore sentiment.
For the purpose of this project, I shall limit my analysis to pairs of words, or “bigrams”. You can certainly analyze further by using “trigrams” (n=3). Hence more generally, a token comprising n words is called an “n-gram or ngram”. Tokenizing on bigrams would allow me to capture and examine the immediate context around each word.
The output is word-pairs in the column bigram. The bigrams are then separated into columns word1 and word2, before filtering for numbers and stopwords. You can choose to recombine word1 and word2 back into bigrams, but I chose to leave them separated.
Here’s a table of the top 20 “paired words” in terms of frequency of usage:
| word1 | word2 | frequency |
|---|---|---|
| love | y’all | 160 |
| sleep | tight | 154 |
| y’all | tmr | 144 |
| bed | bugs | 106 |
| bugs | bite | 106 |
| coming | home | 105 |
| tight | don’t | 103 |
| tmr | sleep | 103 |
| bye | bye | 100 |
| kor | kor | 79 |
| mom | love | 76 |
| water | polo | 68 |
| otw | home | 66 |
| bowling | alley | 63 |
| car | park | 63 |
| pls | don’t | 61 |
| marcy | pls | 58 |
| don’t | worry | 57 |
| sweet | dreams | 55 |
| yeah | yeah | 54 |
Nope! We don’t have bed bugs at home. Instead, the bigrams come from our favorite good-night phrase “sleep tight, don’t let the bed bugs bite”.
Going beyond counting, we can actually visualize the connections and correlations between words in the chatgroup thanks to igraph.
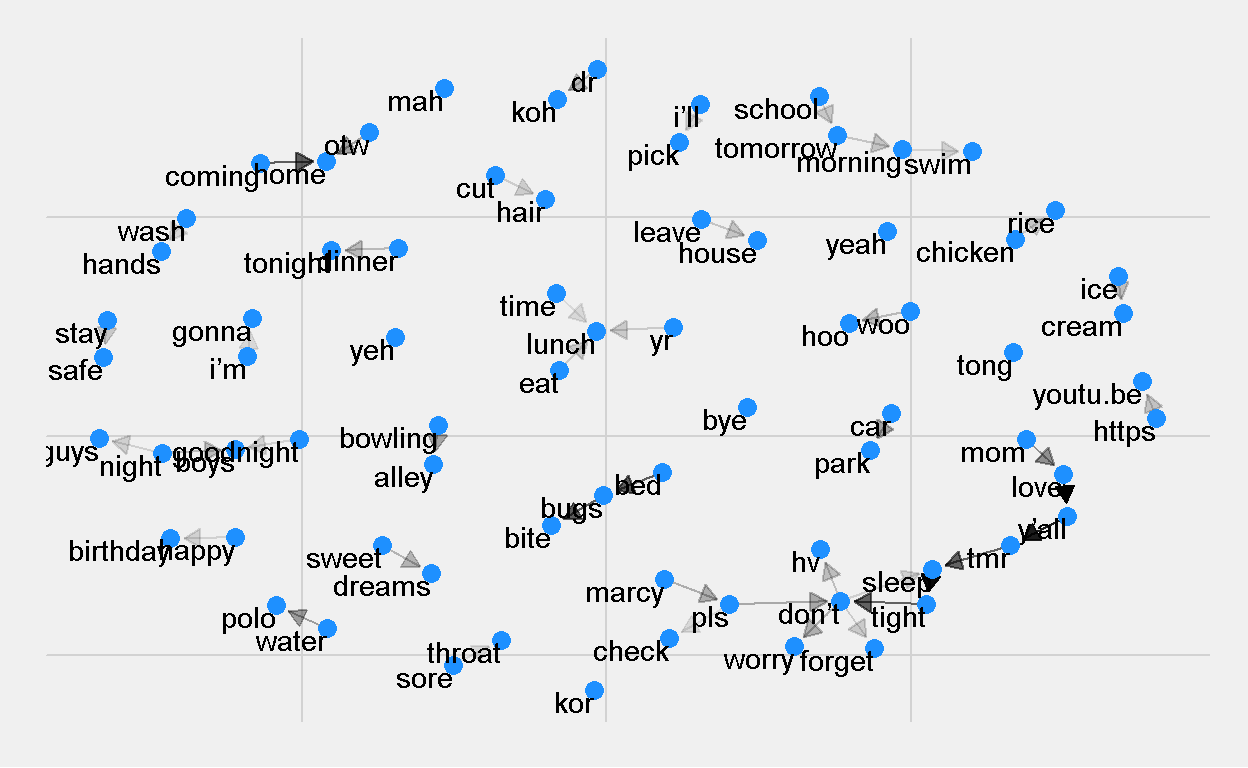
Figure 15: igraph Plot of Top 50 bigrams
And here’s the cool looking igraph, where arrows show the direction of correlation between words. The weights of the arrows shoe the number of times each bigram is used. The graph plots the top 50 bigrams used in our chat. That’s so cool!
As you can see, there aren’t any “negating words” such as “not love” or bigrams with “negative-positive” sentiment within the top 50 bigrams. As the bulk of this chat happened during the covid and post-covid period, you’ll see interesting bigrams like “wear mask”, “stay safe” and “sore throat”.
Sentiment Analysis using Bing
Recall that Bing is a general purpose English sentiment lexicon that categorizes words in a binary fashion, either positive or negative.
Here is the top 10 most frequently used words in our chatgroup, indexed using Bing. Within this list, there are 9 positive sentiment words and 1 negative sentiment word.
| word1 | word2 | frequency |
|---|---|---|
| positive | love | 1241 |
| positive | nice | 478 |
| positive | ready | 370 |
| positive | wow | 332 |
| negative | bad | 244 |
| positive | fun | 225 |
| positive | safe | 201 |
| positive | free | 184 |
| positive | happy | 156 |
| positive | clean | 155 |
Here is a plot comparing the top 10 negative and positive sentiment words used in our chat. I’m happy to see that the use of positive sentiment words far overwhelm the use of negative sentiment words.
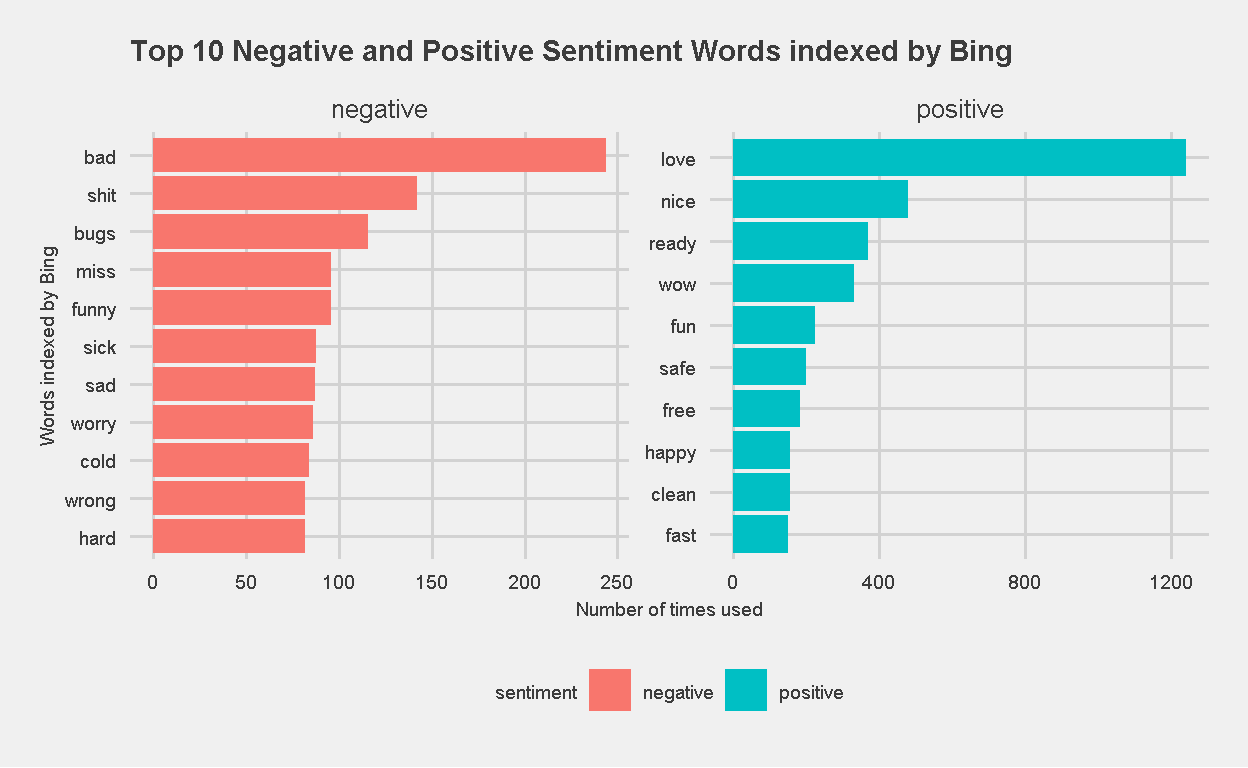
Figure 16: Top 10 Negative and Positive Sentiment Words, indexed by Bing
Here’s a different way of looking at the same data, this time the usage of negative sentiment words is represented on the negative x-axis. Which way of visualization do you prefer?
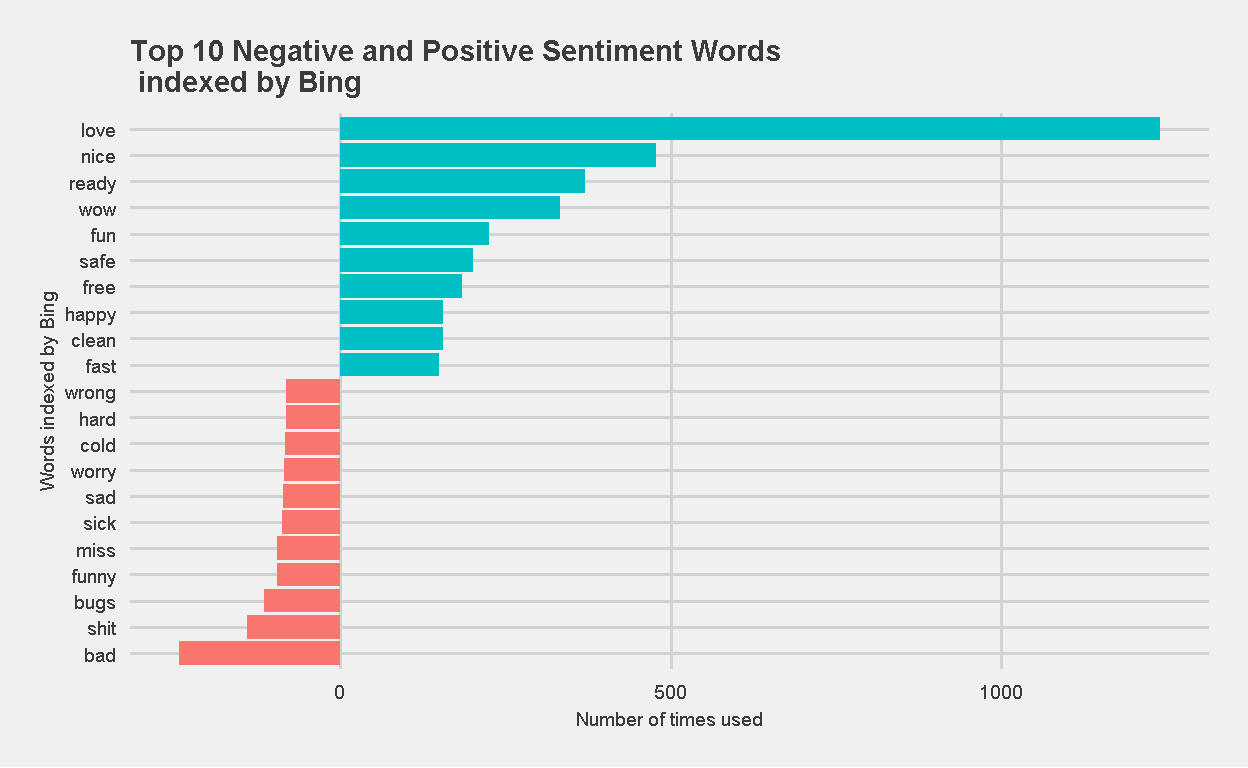
Figure 17: Top 10 Negative and Positive Sentiment Words, indexed by Bing, represented on negative-positive scale
Net Sentiment Using Bing
Although Bing classifies words in a binary manner, positive or negative, it is still possible to calculate a score that gives you an indication of the overall sentiment. Each occurrence of a positive word is given a sentiment score of “+1”, while a negative word is given a sentiment score of “-1”. This allows me to calculate a net sentiment score, and in this case, I did so for each member of the family.
What do you think this analysis will reveal? Are you surprised by the result?
| Family Member | Net Sentiment |
|---|---|
| Aaangelina | 635 |
| Andrew | 184 |
| Marc | -168 |
| Mark | 734 |
Next, I investigated the top 10 most frequently used positive and negative words by each member of the family. The chart was easily created using facet_wrap().
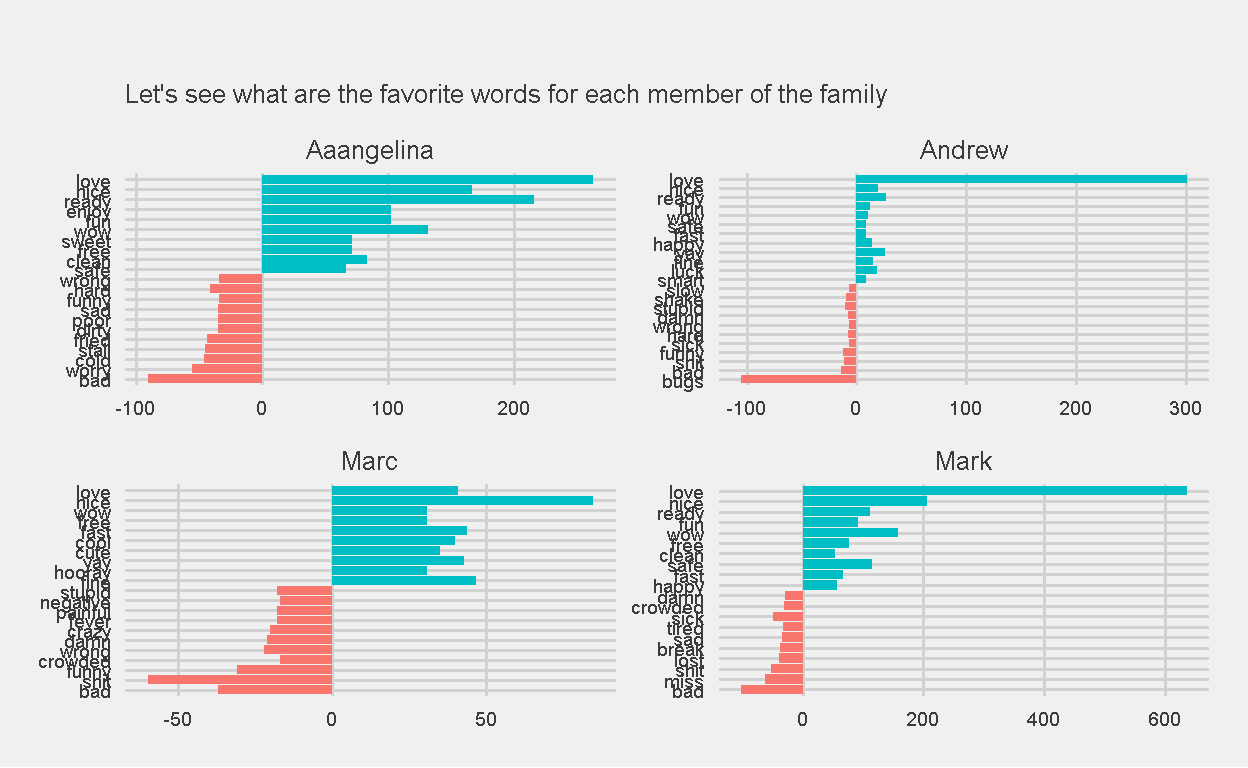
Figure 18: Top 10 Frequently used Positive and Negative words, indexed by Bing, for each family member
Recall from earlier, I am the top user of the word “love” within the chat group. Well, Bing picked that up too. Now, why isn’t my AFINN average sentiment index much higher? Hmmm, the only plausible explanation is that I must be using negative sentiment words quite frequently as well. 🤷♂️
As for Marc, his number of negative sentiment words used (1038) outnumbers the number of positive sentiment words used (870). But his top 10 negative and positive words used is quite balanced.
Sentiment Analysis using NRC
The NRC Emotion Lexicon is a list of 5,636 English words and their associations with eight basic emotions (anger, fear, anticipation, trust, surprise, sadness, joy, and disgust) and two sentiments (negative and positive). A word can be listed under multiple emotions. For example, the word “bad” is listed under the emotions anger, disgust, fear, and sadness, as well as the negative sentiment.
A total of 35,688 words from the chatgroup were indexed by NRC, and here is a summary by the eight basic emotions:
| Sentiment | Number of Words | Frequency |
|---|---|---|
| anticipation | 9556 | 26.78 |
| trust | 6775 | 18.98 |
| joy | 5563 | 15.59 |
| fear | 3549 | 9.94 |
| sadness | 3127 | 8.76 |
| anger | 2459 | 6.89 |
| surprise | 2404 | 6.74 |
| disgust | 2255 | 6.32 |
I always prefer to look at things visually, so here’s a plot of the Top 10 words for each of the eight emotions.
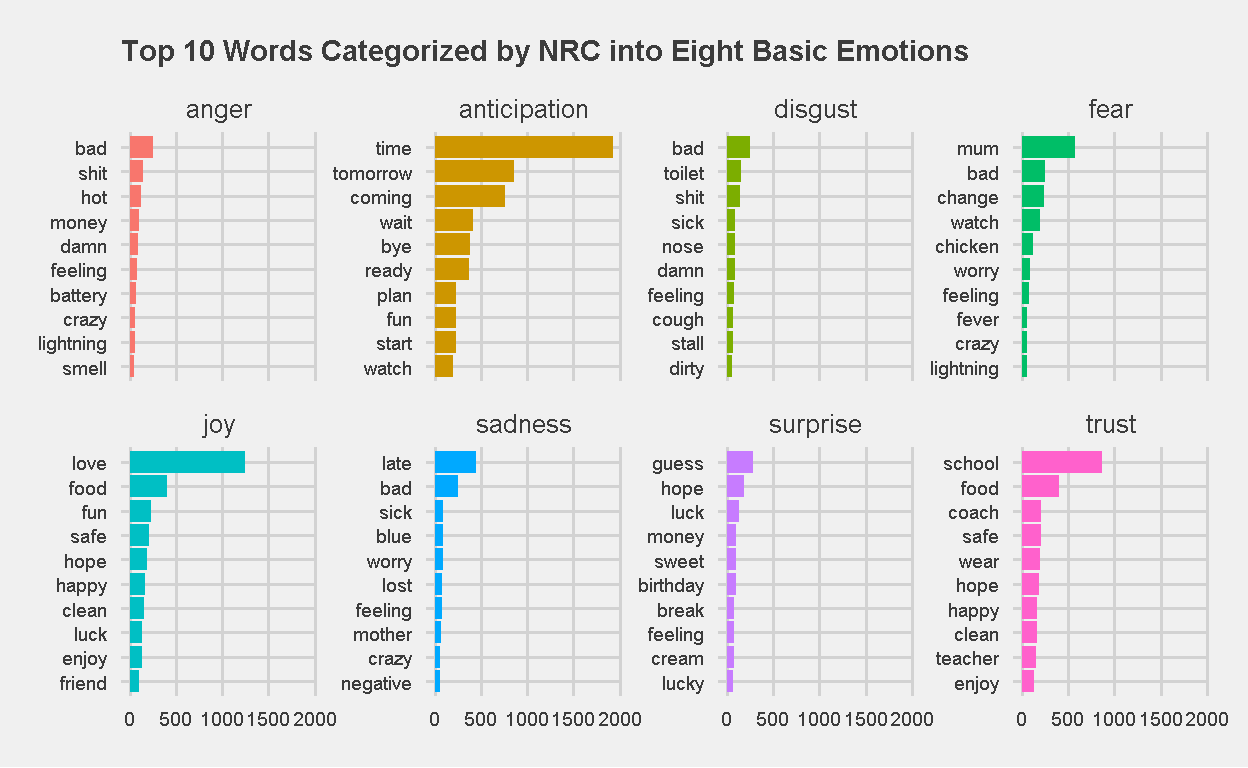
Figure 19: Top 10 Words Categorized by NRC into Eight Basic Emotions
Its comes as no surprise to me that about 27 percent of words were categorized under the “anticipation” emotion. After all, we do use the chat quite frequently to coordinate our schedules and transportation needs. Its interesting that NRC was able to pick this up.
However, I noticed that NRC does have its quirks. Take a look at the top word in the “fear” emotion. Mum?? I know my wife is a scary person, but how did NRC know that? “Mum” to refer to my wife or my mother (or their mother, if you were my children). Perhaps in this case, NRC mistook it as “to keep quiet”? Perhaps we should spell it as “mom” from now on in our chats?
Do you notice any other strange classifications? battery <-> Anger, mother <-> Sadness are a few more that may have been incorrectly classified.
The next plot shows the relative frequency of each family member’s word usage by the eight basic NRC sentiments.
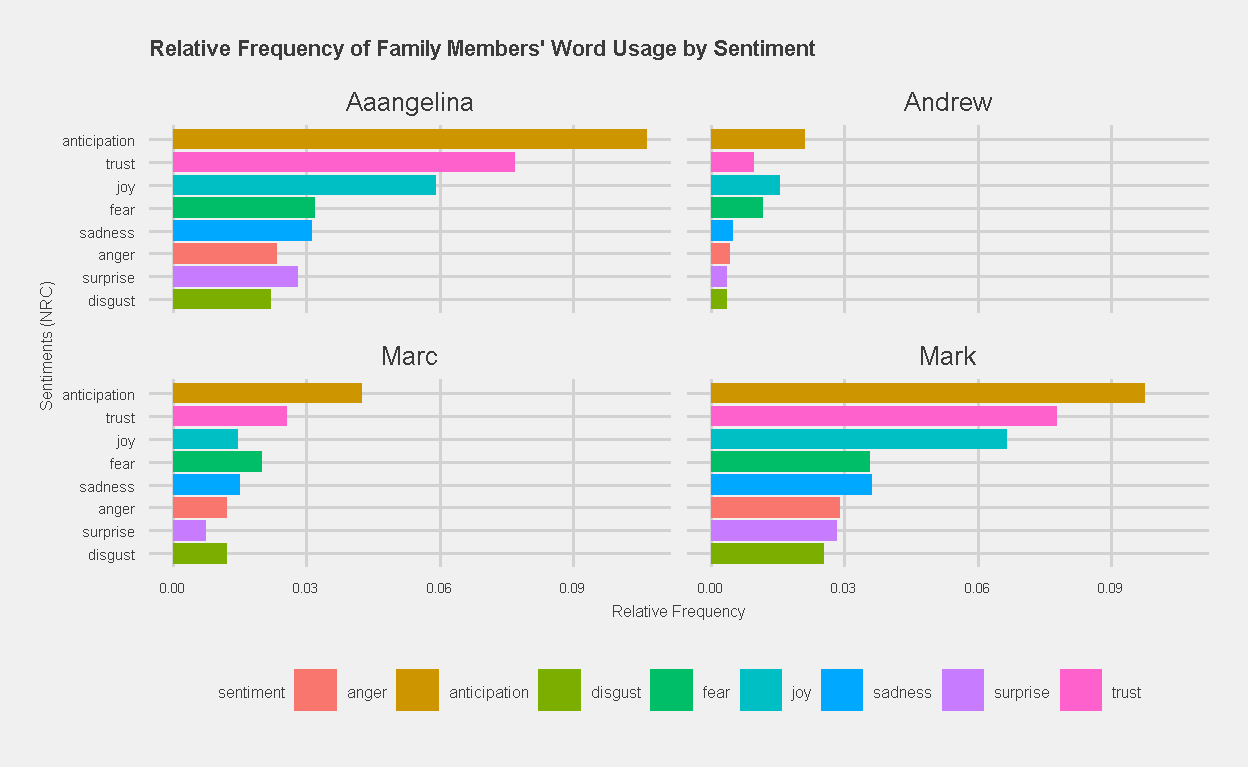
Figure 20: Relative Frequency of Family Members’ Word Usage by Sentiment, indexed by NRC
What do you make of the results? Well, as parents, I suppose its normal that Angelina and I have the highest frequency of words in the “anticipation” category. Its also heartening to see that categories associated with negative sentiment (fear, anger, sadness and disgust) do not rank highly among our family members.
Final Thoughts
I had fun working on this project. Not only did my skills in R impRove, it also revealed some interesting insights about my family members.
Was the analysis ground-breaking? Definitely not, and admittedly, there was a lot more I could have done, eg: tf-idf, analysis by tri-grams, by topic, or even at the sentence level. Maybe I’ll do a more comprehensive analysis after I complete the next module on Machine Learning next year. Thanks for reading!